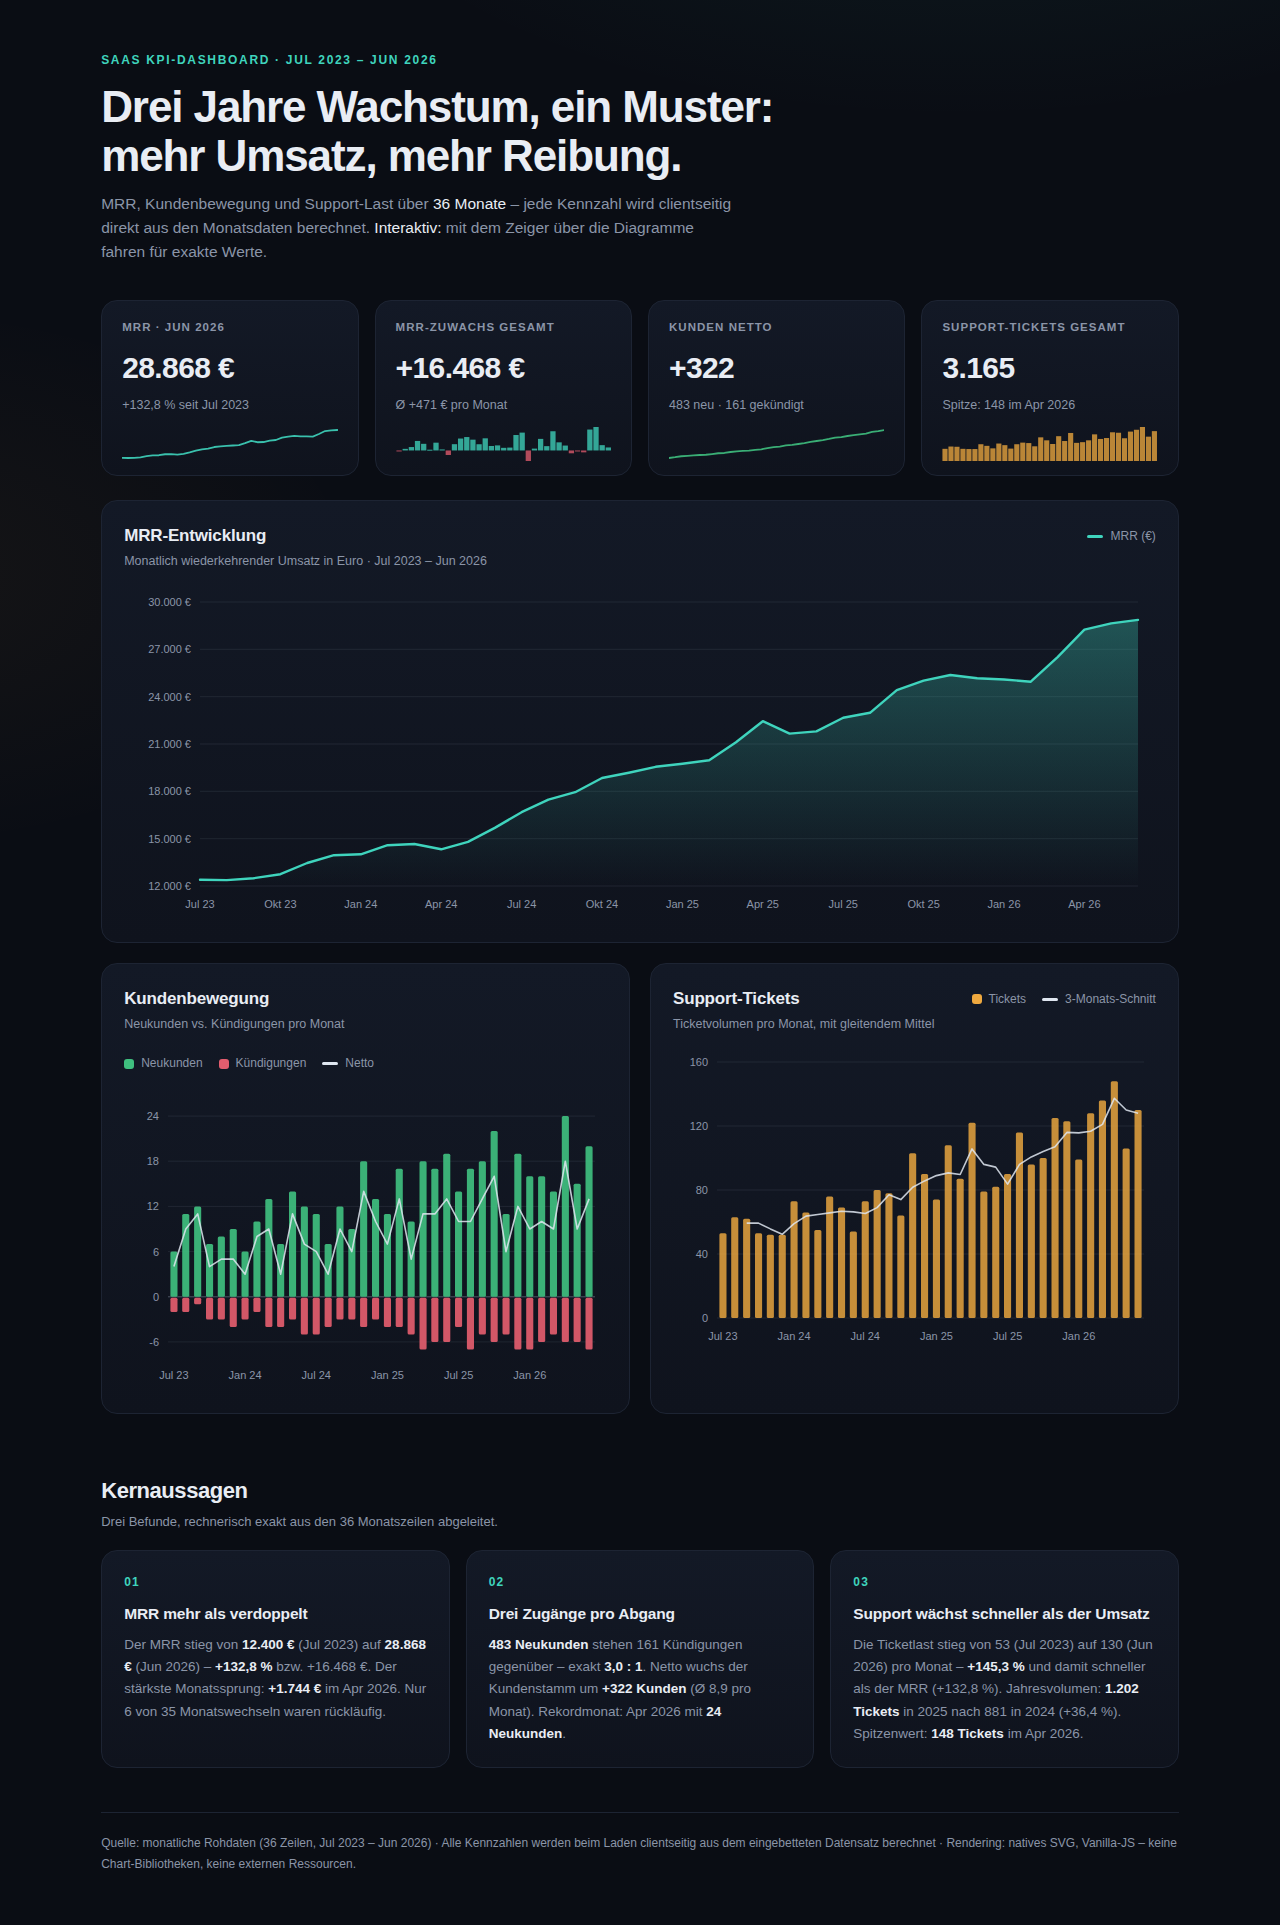
Claude Fable 5
via claude-code-cli 2.1.214model + harness
Run of 18 Jul 2026
Check results withdrawn (4 Oct 2026)
1 format check passed — no check of the result · 2 render and interaction checks not run
Evaluation not published
One brief, every published result. Each tile is what one model returned.
5 runs · 5 modelsRuns from 17 Jul 2026 to 3 Sept 2026
Check results withdrawn (4 Oct 2026)These check results do not match the screenshots of the same runs. We are therefore withdrawing the results until the check has been repeated in the browser. Affected: three_distinct_visualizations, five_aggregate_matches, three_numeric_insights.
via claude-code-cli 2.1.214model + harness
Run of 18 Jul 2026
Check results withdrawn (4 Oct 2026)
1 format check passed — no check of the result · 2 render and interaction checks not run
Evaluation not published
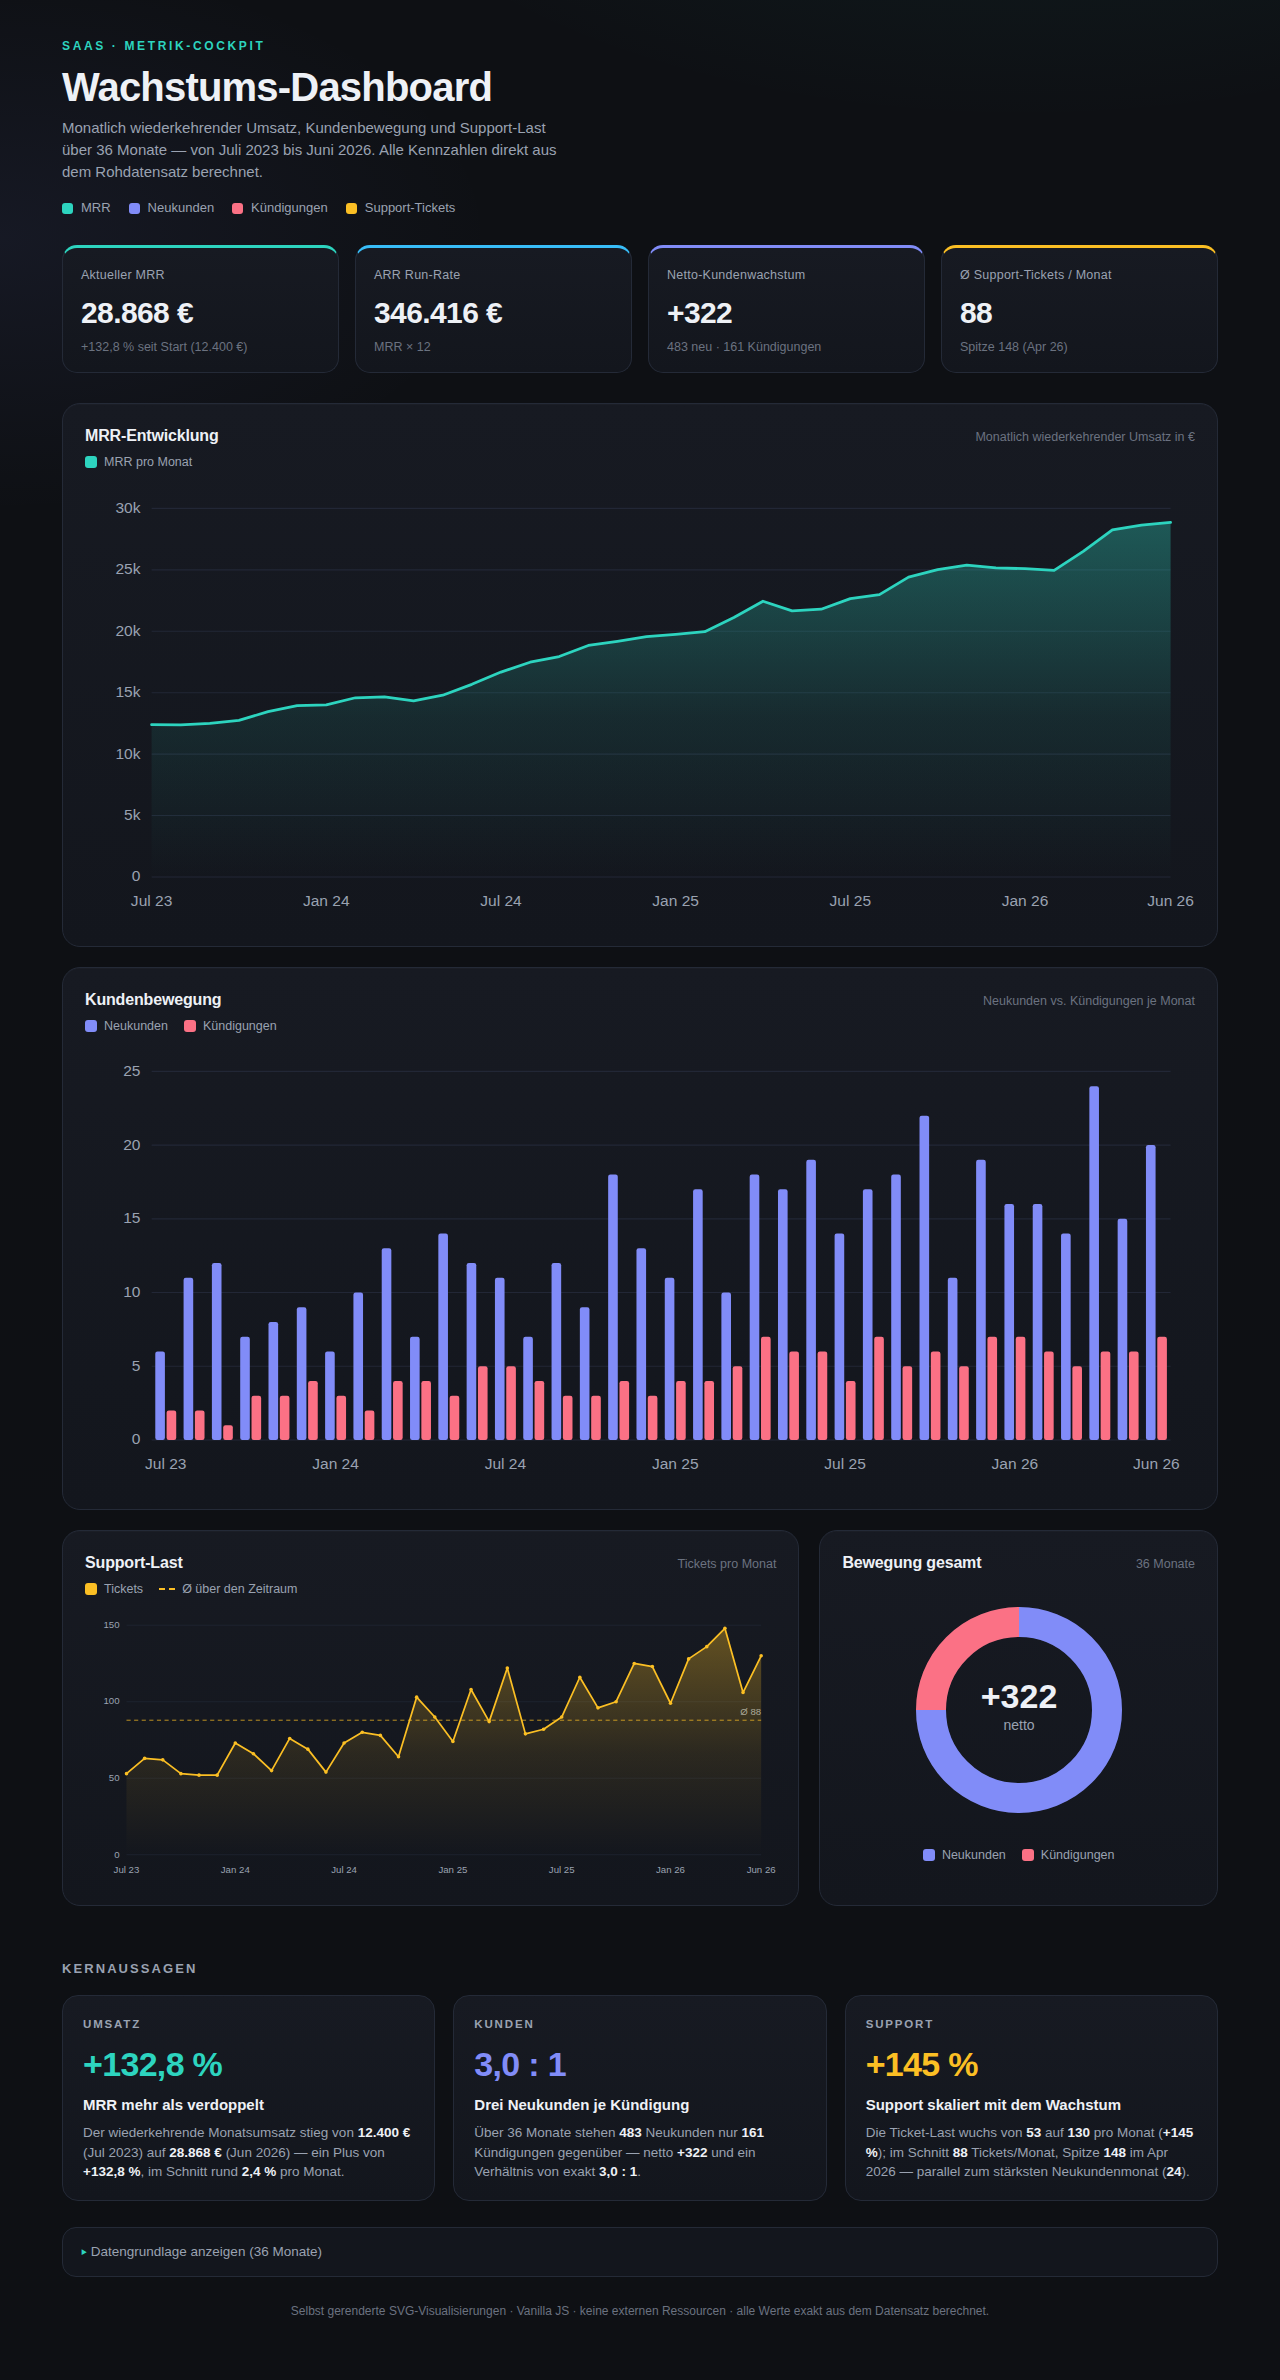
via claude-code-cli 2.1.212model + harness
Run of 17 Jul 2026
Check results withdrawn (4 Oct 2026)
1 format check passed — no check of the result · 2 render and interaction checks not run
Evaluation not published
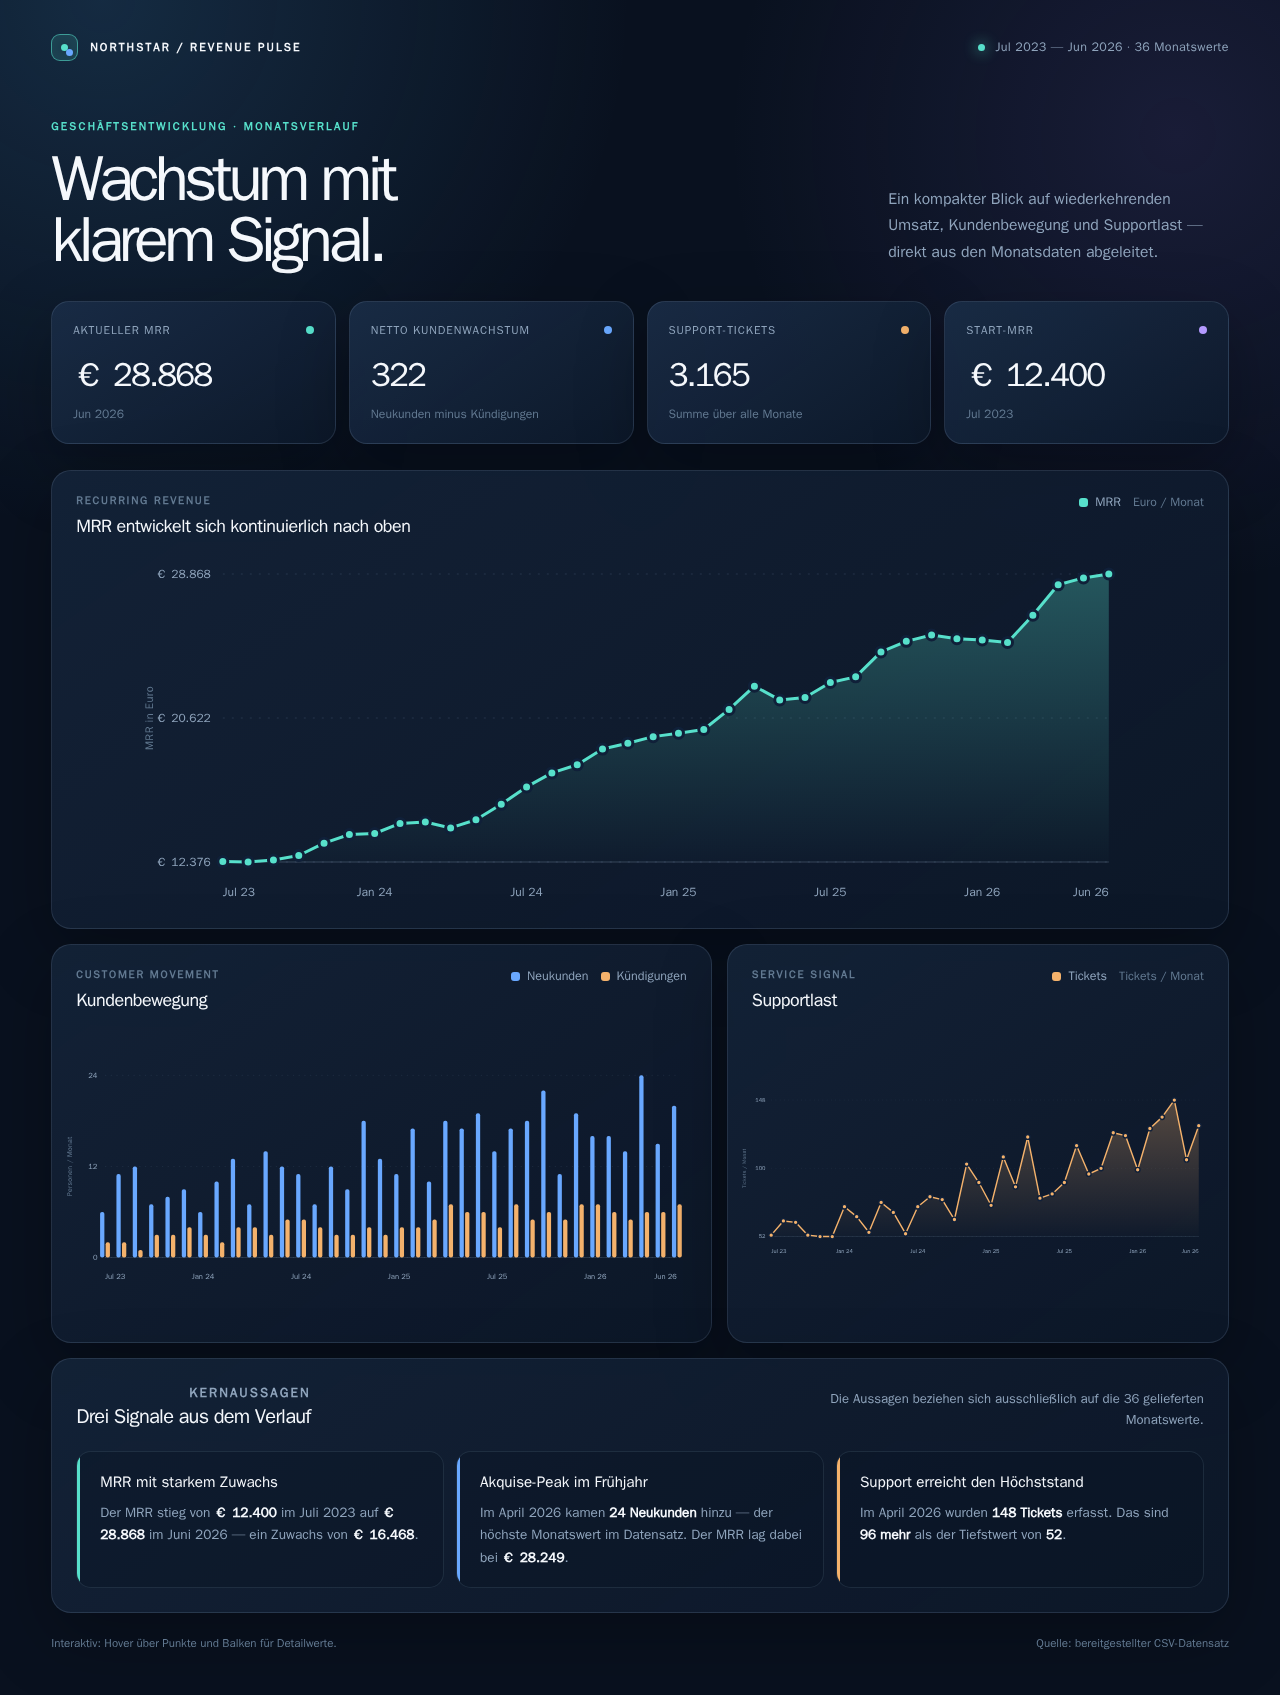
via codex-cli 0.144.5model + harness
Run of 18 Jul 2026
Check results withdrawn (4 Oct 2026)
1 format check passed — no check of the result · 2 render and interaction checks not run
Evaluation not published
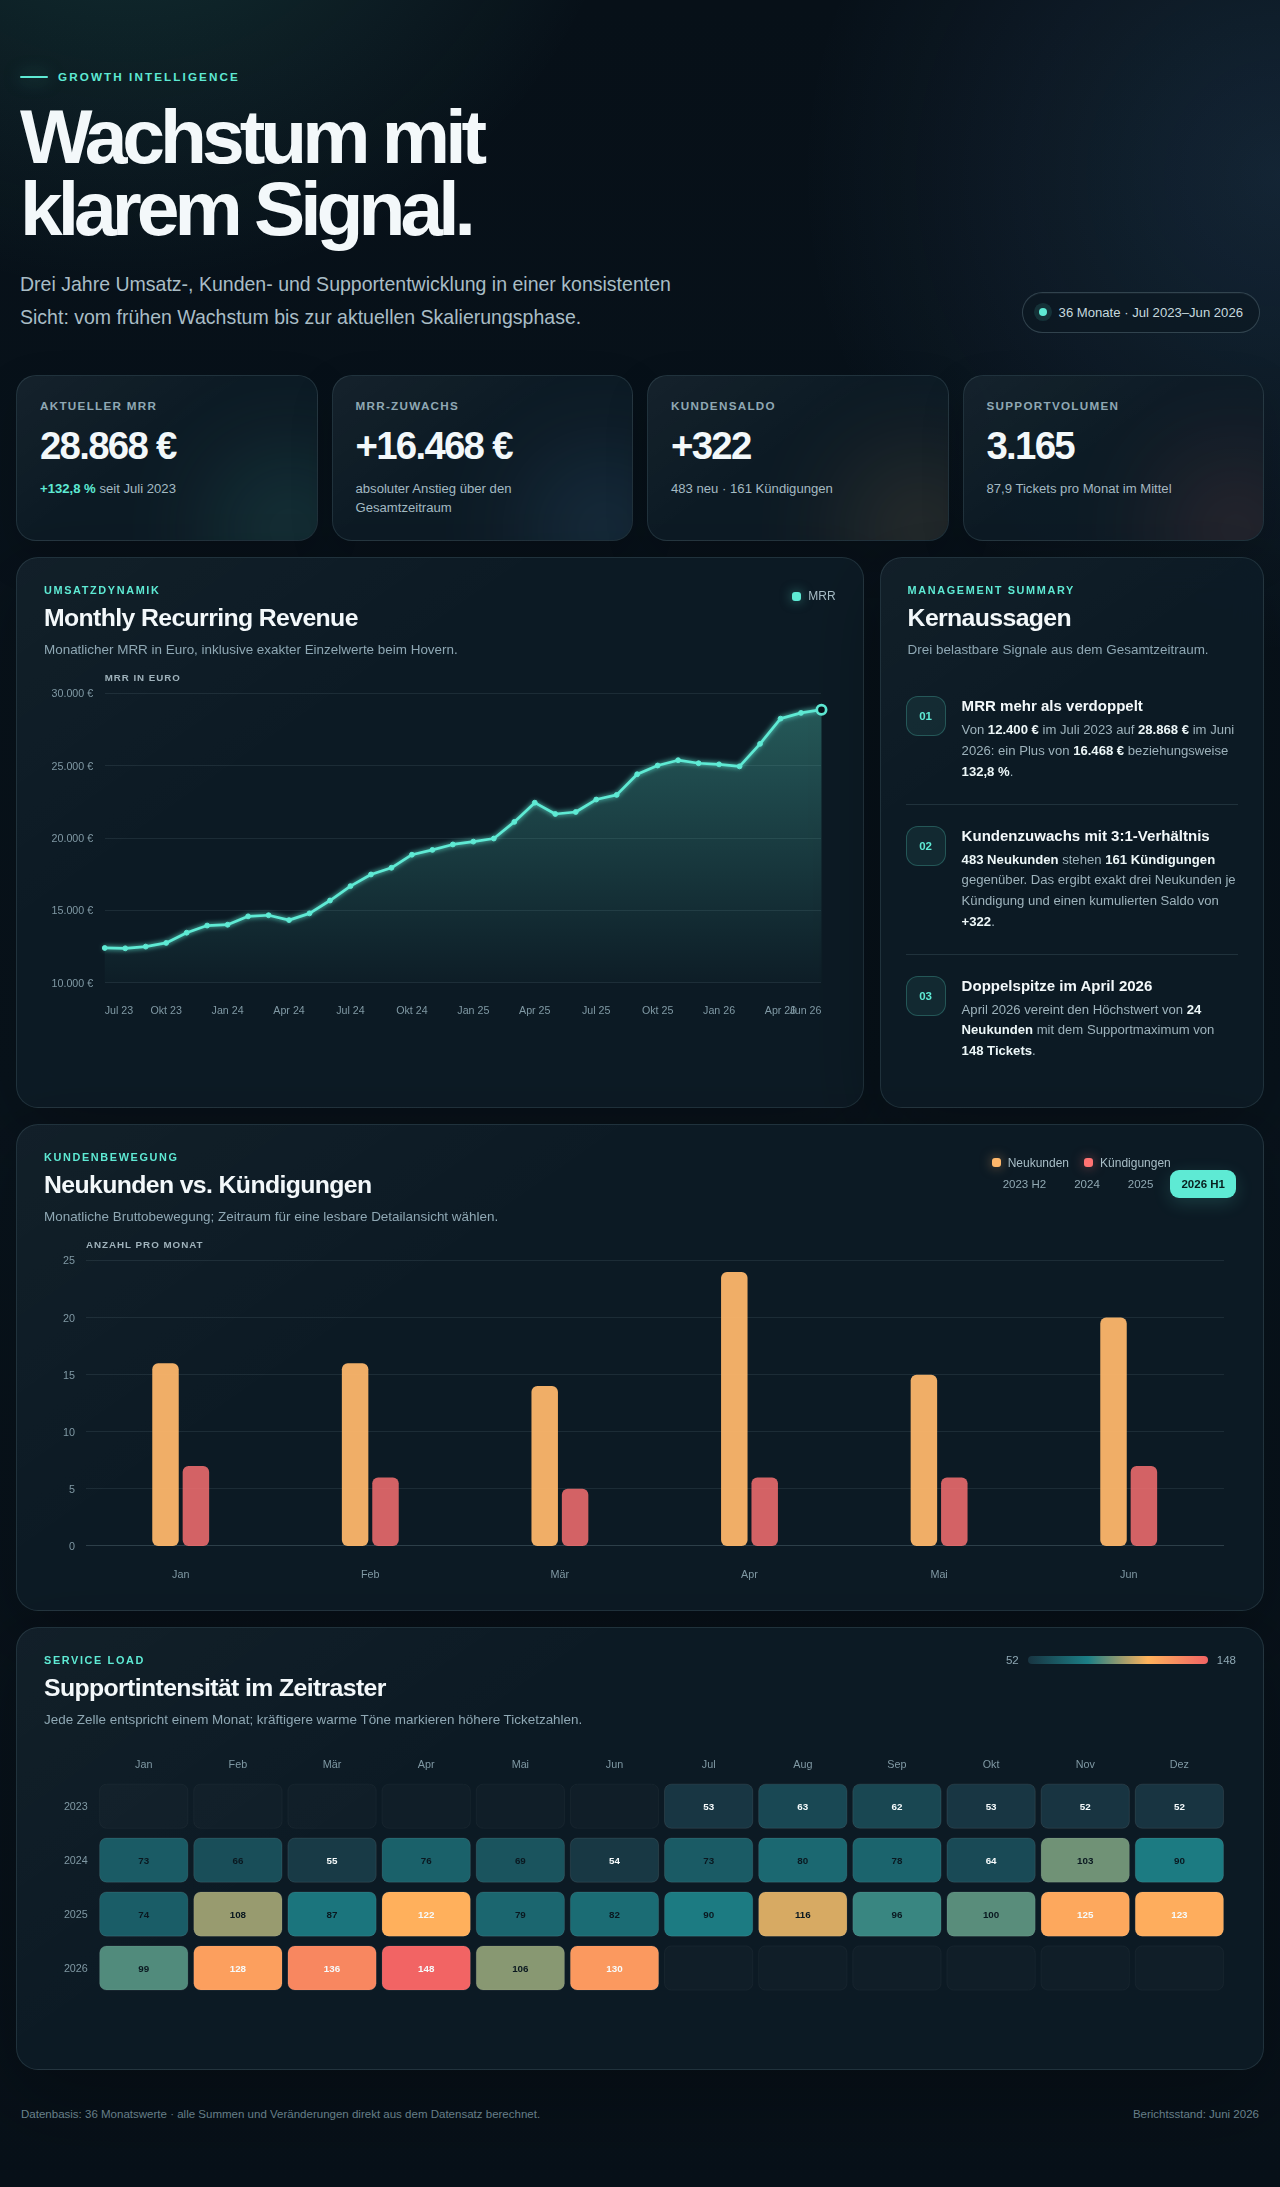
via codex-cli 0.144.5model + harness
Run of 17 Jul 2026
Check results withdrawn (4 Oct 2026)
1 format check passed — no check of the result · 2 render and interaction checks not run
Evaluation not published
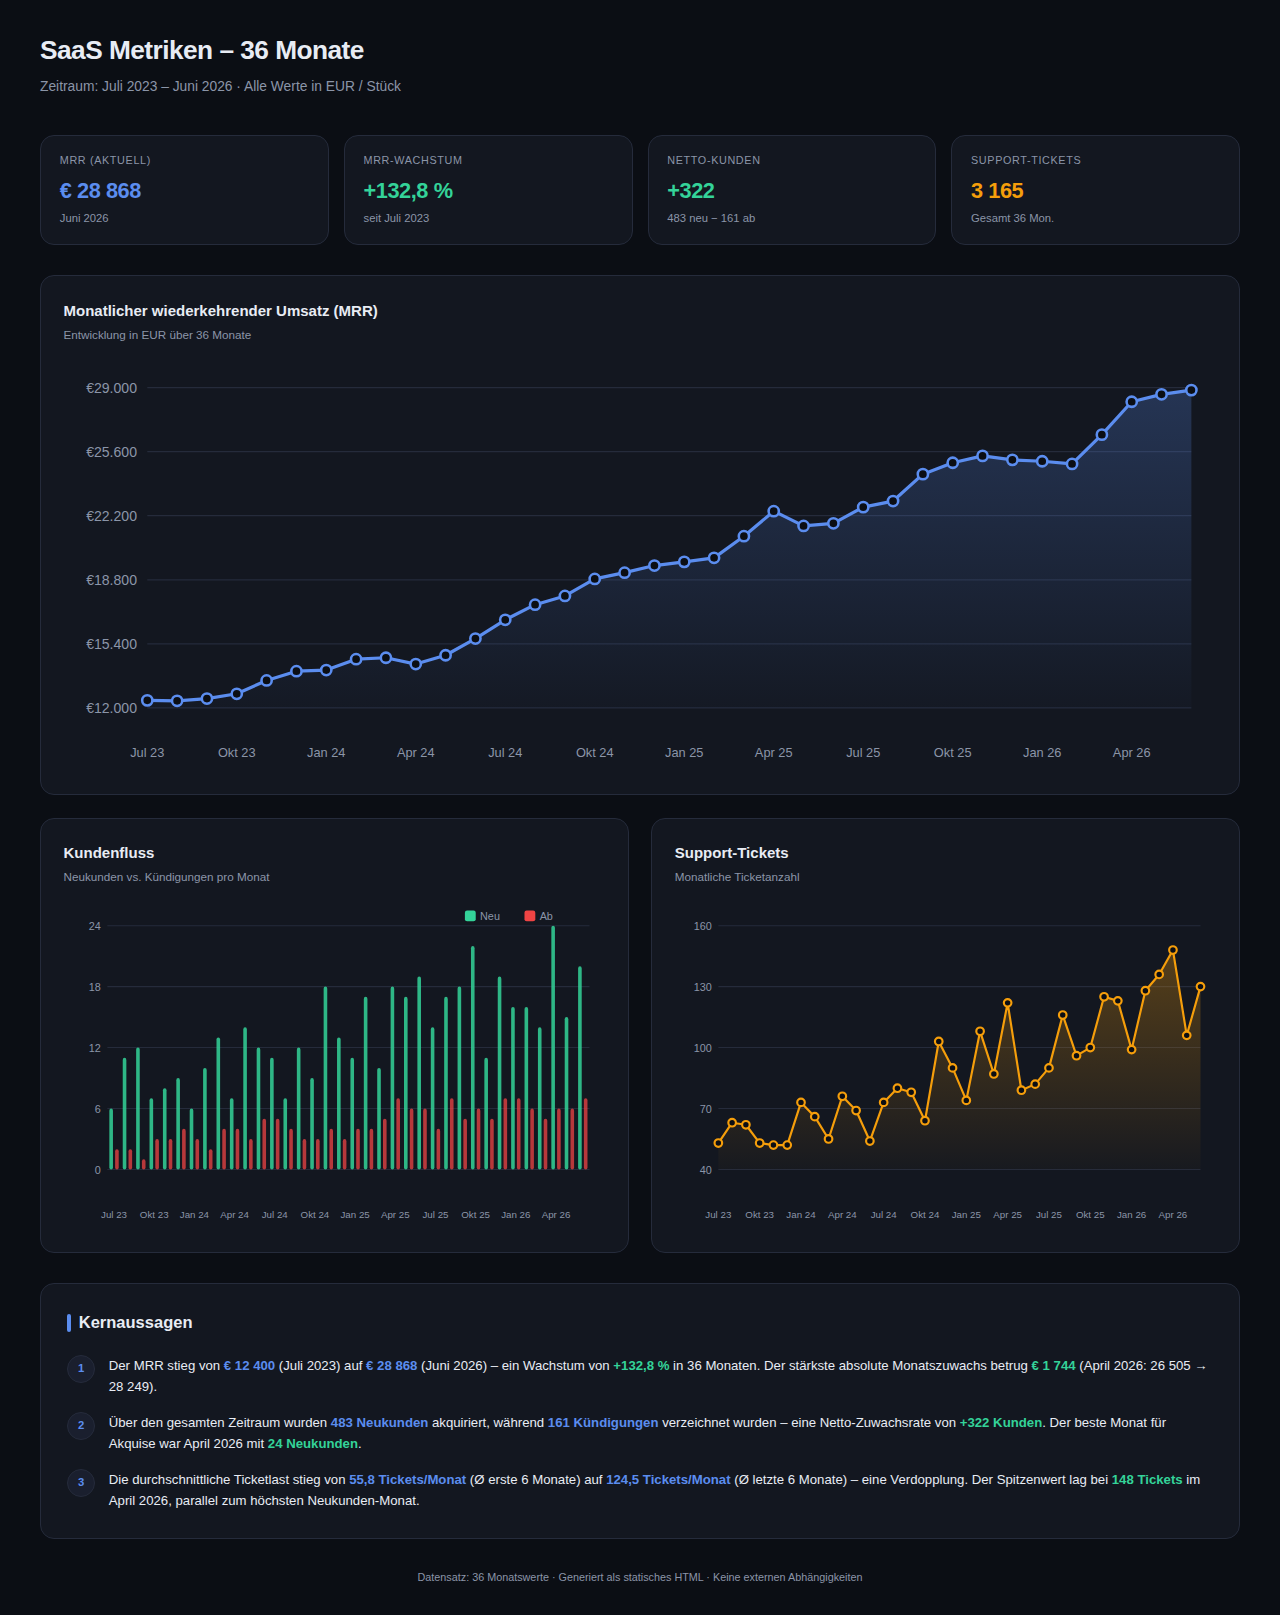
via ollama 0.32.15model only
Run of 3 Sept 2026
Check results withdrawn (4 Oct 2026)
1 format check passed — no check of the result · 2 render and interaction checks not run
Evaluation not published
Runs of the same task are not automatically tested alike: runtime, token limit and protocol can differ. Each run lists its own.
5 of 16 verified v2 runs of this task are published. 5 of the 6 models with recorded runs have a published run.Not published: Phi-4-mini-instruct (1 run; check results withdrawn).Source: the selection records of the published runs. They count the task across its variants and know only models with at least one published run.
Unten steht ein CSV-Datensatz (ca. 40 Zeilen). Baue daraus eine einzelne HTML-Datei als beeindruckendes, interaktives Dashboard.
Anforderungen:
- Mindestens 3 Visualisierungen, selbst gerendert als SVG oder Canvas — keine Chart-Libraries, keine externen Assets, keine externen Requests.
- Interaktivität mit Vanilla-JS: beim Hovern über Datenpunkte/Balken/Segmente erscheinen präzise Tooltips mit dem konkreten Wert; Achsen und Legenden sind lesbar beschriftet.
- Eine Sektion „Kernaussagen" mit 3 datengestützten Insights; jeder Insight nennt mindestens eine konkrete Zahl aus den Daten.
- Alle gezeigten Zahlen müssen rechnerisch exakt aus dem Datensatz folgen.
- Gestaltung auf Studio-Niveau: klare Hierarchie, stimmige Farbwelt, ruhige Typografie, sinnvoll gewählte Diagrammtypen für die jeweilige Kennzahl. Responsive, kein horizontaler Overflow.
Datensatz:
[CSV, 36 Datenzeilen: Monats-KPIs eines B2B-SaaS (Juli 2023 bis Juni 2026): MRR, Neukunden, Kuendigungen, Support-Tickets.]From the task seed (German original); the actual prompts add output-format instructions and other wording.